VirtualFlow の実行
概要
- ここではバーチャルスクリーニングを実行可能なプラットフォームである VirtualFlow をインストールし、実行します。
- 本ハンズオンで実施するシナリオは VirtualFlow の公式ドキュメントに記載されている Tutorial 1 をもとに作成しております。
本ハンズオンは Slurm を使用するクラスター環境を前提とした内容となっております。Slurm 以外のジョブスケジューラを設定したクラスター環境の方は Slurm を使用するクラスター環境を作成したのち、本ハンズオンを実施してください。
本ハンズオンでは NICE DCV を使用する手順があります。ドッキングポーズの可視化を行う場合は AWS ParallelCluster の config ファイルで Head Node の NICE DCV を有効としているか確認してください。
ターゲットとシナリオ
- ターゲット構造はヒトグルコキナーゼ(GK)であり、使用される構造は PDB ID 4NO7 となります。
- VirtualFlow によって事前に構成されたドッキングシナリオをもとに活性化化合物候補を見つける内容となっています。
- ドッキングシナリオにはスクリーニング対象の 1123 個のリガンドが含まれています。
準備1(VirtualFlow のインストール)
- チュートリアル用に用意されている VirtualFlow のファイル群をダウンロードします。
cd /shared
wget https://virtual-flow.org/sites/virtual-flow.org/files/tutorials/VFVS_GK.tar
tar -xvf VFVS_GK.tar
- ファイル
VFVS_GK/tools/templates/all.ctrl を編集します。
cd VFVS_GK/tools/
vim templates/all.ctrl
partition=test の値を compute に変更します。
ligands_todo_per_queue=100 の値を 10 に変更して保存します。
ligands_todo_per_queue=10
設定ファイル all.ctrl は使用するクラスター/バッチシステムに応じて調整する必要があります。
ここでは all.ctrl の partition 値を Slurm で設定されている値に合わせて変更しています。
また、今回対象のリガンド数は 1123 個なので queue あたりのリガンド数を 10 として、このあとの手順で 120 ジョブを実行します。
準備2(Slurm の設定を変更する)
- AWS ParallelCluster で Slurm のメモリオプションを使用するため、設定を追加します。
sudo vim /opt/slurm/etc/slurm.conf
#PARTITION:compute
NodeName=DEFAULT RealMemory=7469
設定は必ず include slurm_parallelcluster_nodes.conf の行より前に追加します。
sudo systemctl restart slurmctld.service
RealMemory に設定した値は compute node である c5.xlarge の値を設定しております。
RealMemory 値を確認するには compute node で /opt/slurm/sbin/slurmd -C を実行します。
準備3(必要なディレクトリを作成する)
- スクリプトを実行し、必要な Workflow と Output のフォルダーを作成する
Do you really wish prepare/reset the output-files folder? y

 * Preparing the output-files folder...

Do you really wish to prepare/reset the workflow folder? y

 * Preparing the workflow folder...

The templates were copied.
Workflow を実行する
- 今回はクラスターで 120 個のジョブを並行処理します。
./vf_start_jobline.sh 1 120 templates/template1.slurm.sh submit 1
EC2 コンソール画面より、Compute Node のインスタンスが一斉に起動することを確認することが可能です。
- ワークフローをモニタリングするには
vf_report.sh を実行します。
./vf_report.sh -c workflow
モニタリング結果の例
        ::  ::  ::  ::::. :::::: ::  ::  .::::.  ::      :::::  ::    .::::. ::      ::
        ::  ::  ::  :: ::   ::   ::  ::  ::  ::  ::      ::     ::    ::  :: ::  ::  ::
         ::::   ::  :::.    ::   ::  ::  ::::::  ::      :::::  ::    ::  ::  ::::::::
          ::    ::  :: ::   ::    ::::   ::  ::  ::::    ::     ::::: '::::'   ::  ::


                                  Wed Aug 19 23:58:42 UTC 2020


                                         Workflow Status
::::::::::::::::::::::::::::::::::::::::::::::::::::::::::::::::::::::::::::::::::::::::::::::::


                                             Joblines
................................................................................................

 Number of jobfiles in the workflow/jobfiles/main folder: 120
 Number of joblines in the batch system: 35
 Number of joblines in the batch system currently running: 35
  * Number of joblines in queue "compute" currently running: 35
 Number of joblines in the batch system currently not running: 0
  * Number of joblines in queue "compute" currently not running: 0
 Number of cores/slots currently used by the workflow: 35


                                            Collections
................................................................................................

 Total number of ligand collections: 68
 Number of ligand collections completed: 20
 Number of ligand collections in state "processing": 35
 Number of ligand collections not yet started: 13


                                 Ligands (in completed collections)
................................................................................................

 Total number of ligands: 1123
 Number of ligands started: 49
 Number of ligands successfully completed: 49
 Number of ligands failed: 0


                                Dockings (in completed collections)
................................................................................................

 Docking runs per ligand: 2
 Number of dockings started: 98
 Number of dockings successfully completed: 98
 Number of dockings failed: 0
- また、
squeue コマンドでキューのノード実行状況を表示することも可能です。
squeueコマンドの出力例
             JOBID PARTITION     NAME     USER ST       TIME  NODES NODELIST(REASON)
                42   compute   t-41.1   centos PD       0:00      1 (Resources)
                43   compute   t-42.1   centos PD       0:00      1 (Priority)
                44   compute   t-43.1   centos PD       0:00      1 (Priority)
                45   compute   t-44.1   centos PD       0:00      1 (Priority)

(中略)

               120   compute  t-119.1   centos PD       0:00      1 (Priority)
               121   compute  t-120.1   centos PD       0:00      1 (Priority)
                 2   compute    t-1.1   centos  R       4:45      1 ip-10-0-38-68
                 3   compute    t-2.1   centos  R       4:42      1 ip-10-0-38-68
                 4   compute    t-3.1   centos  R       4:42      1 ip-10-0-38-68
                 5   compute    t-4.1   centos  R       4:42      1 ip-10-0-38-68
                 6   compute    t-5.1   centos  R       0:31      1 ip-10-0-35-34
                 7   compute    t-6.1   centos  R       0:31      1 ip-10-0-35-34
                 8   compute    t-7.1   centos  R       0:31      1 ip-10-0-35-34
                 9   compute    t-8.1   centos  R       0:31      1 ip-10-0-35-34
                10   compute    t-9.1   centos  R       0:31      1 ip-10-0-35-214
                11   compute   t-10.1   centos  R       0:31      1 ip-10-0-35-214
                12   compute   t-11.1   centos  R       0:31      1 ip-10-0-35-214
                13   compute   t-12.1   centos  R       0:31      1 ip-10-0-35-214
                14   compute   t-13.1   centos  R       0:31      1 ip-10-0-39-110
                15   compute   t-14.1   centos  R       0:31      1 ip-10-0-39-110
                16   compute   t-15.1   centos  R       0:31      1 ip-10-0-39-110
                17   compute   t-16.1   centos  R       0:31      1 ip-10-0-39-110
                18   compute   t-17.1   centos  R       0:31      1 ip-10-0-40-19
                19   compute   t-18.1   centos  R       0:31      1 ip-10-0-40-19
                20   compute   t-19.1   centos  R       0:31      1 ip-10-0-40-19
                21   compute   t-20.1   centos  R       0:31      1 ip-10-0-40-19
                22   compute   t-21.1   centos  R       0:31      1 ip-10-0-40-95
                23   compute   t-22.1   centos  R       0:31      1 ip-10-0-40-95
                24   compute   t-23.1   centos  R       0:31      1 ip-10-0-40-95
                25   compute   t-24.1   centos  R       0:31      1 ip-10-0-40-95
                26   compute   t-25.1   centos  R       0:31      1 ip-10-0-40-205
                27   compute   t-26.1   centos  R       0:31      1 ip-10-0-40-205
                28   compute   t-27.1   centos  R       0:31      1 ip-10-0-40-205
                29   compute   t-28.1   centos  R       0:31      1 ip-10-0-40-205
                30   compute   t-29.1   centos  R       0:31      1 ip-10-0-43-184
                31   compute   t-30.1   centos  R       0:31      1 ip-10-0-43-184
                32   compute   t-31.1   centos  R       0:31      1 ip-10-0-43-184
                33   compute   t-32.1   centos  R       0:31      1 ip-10-0-43-184
                34   compute   t-33.1   centos  R       0:31      1 ip-10-0-44-60
                35   compute   t-34.1   centos  R       0:31      1 ip-10-0-44-60
                36   compute   t-35.1   centos  R       0:31      1 ip-10-0-44-60
                37   compute   t-36.1   centos  R       0:31      1 ip-10-0-44-60
                38   compute   t-37.1   centos  R       0:31      1 ip-10-0-47-23
                39   compute   t-38.1   centos  R       0:31      1 ip-10-0-47-23
                40   compute   t-39.1   centos  R       0:31      1 ip-10-0-47-23
                41   compute   t-40.1   centos  R       0:31      1 ip-10-0-47-23
設定によってワークフローのすべてのジョブが完了するには時間がかかります。
すべての計算が終了していない状態でも、計算が完了しているジョブの結果は出力されているため、ワークフロー実行後 10 - 15 分ほどしたら手順を進めて問題ありません。
- スクリーニングの途中結果を表示するには、以下のコマンドを実行します。
./vf_report.sh -c vs -d qvina02_rigid_receptor1 -n 10
スクリーニングの途中結果の例
        ::  ::  ::  ::::. :::::: ::  ::  .::::.  ::      :::::  ::    .::::. ::      ::
        ::  ::  ::  :: ::   ::   ::  ::  ::  ::  ::      ::     ::    ::  :: ::  ::  ::
         ::::   ::  :::.    ::   ::  ::  ::::::  ::      :::::  ::    ::  ::  ::::::::
          ::    ::  :: ::   ::    ::::   ::  ::  ::::    ::     ::::: '::::'   ::  ::


                                  Fri Jan 29 09:08:50 UTC 2021


                              Preliminary Virtual Screening Results
::::::::::::::::::::::::::::::::::::::::::::::::::::::::::::::::::::::::::::::::::::::::::::::::


                                  Binding affinity - statistics
................................................................................................

 Number of ligands screened with binding affinity between     0  and   inf kcal/mole: 0
 Number of ligands screened with binding affinity between  -0.1  and  -5.0 kcal/mole: 0
 Number of ligands screened with binding affinity between  -5.0  and  -5.5 kcal/mole: 1
 Number of ligands screened with binding affinity between  -5.5  and  -6.0 kcal/mole: 1
 Number of ligands screened with binding affinity between  -6.0  and  -6.5 kcal/mole: 2
 Number of ligands screened with binding affinity between  -6.5  and  -7.0 kcal/mole: 3
 Number of ligands screened with binding affinity between  -7.0  and  -7.5 kcal/mole: 3
 Number of ligands screened with binding affinity between  -7.5  and  -8.0 kcal/mole: 2
 Number of ligands screened with binding affinity between  -8.0  and  -8.5 kcal/mole: 1
 Number of ligands screened with binding affinity between  -8.5  and  -9.0 kcal/mole: 0
 Number of ligands screened with binding affinity between  -9.0  and  -9.5 kcal/mole: 0
 Number of ligands screened with binding affinity between  -9.5  and -10.0 kcal/mole: 0
 Number of ligands screened with binding affinity between -10.0  and -10.5 kcal/mole: 0
 Number of ligands screened with binding affinity between -10.5  and -11.0 kcal/mole: 0
 Number of ligands screened with binding affinity between -11.0  and -11.5 kcal/mole: 0
 Number of ligands screened with binding affinity between -11.5  and -12.0 kcal/mole: 0
 Number of ligands screened with binding affinity between -12.0  and -12.5 kcal/mole: 0
 Number of ligands screened with binding affinity between -12.5  and -13.0 kcal/mole: 0
 Number of ligands screened with binding affinity between -13.0  and -13.5 kcal/mole: 0
 Number of ligands screened with binding affinity between -13.5  and -14.0 kcal/mole: 0
 Number of ligands screened with binding affinity between -14.0  and -14.5 kcal/mole: 0
 Number of ligands screened with binding affinity between -14.5  and -15.0 kcal/mole: 0
 Number of ligands screened with binding affinity between -15.0  and -20.0 kcal/mole: 0
 Number of ligands screened with binding affinity between -20.0  and  -inf kcal/mole: 0


                          Binding affinity - highest scoring compounds
................................................................................................

       Rank  Ligand                Collection    Highest-Score

       1     Z2046102324_1         GACEAG_00000  -8.2
       2     PV-001961988701_2     GACEAG_00000  -7.7
       3     PV-001961988701_1     GACEAG_00000  -7.6
       4     Z2801580048_1_T1      GACADC_00000  -7.4
       5     PV-001938623963_2_T1  GACBEG_00000  -7.1
       6     PV-001963184488_1     HACBDD_00000  -7.0
       7     Z2800012484_1_T1      GACADC_00000  -6.9
       8     Z2477560609_1_T1      GACAEF_00000  -6.6
       9     PV-001938623963_1_T1  GACBEG_00000  -6.5
       10    PV-001916249351_1     HACBBD_00000  -6.3
リガンドランキングを作成する
- リガンドランキングの作成に必要な VFTools というパッケージをインストールします。
cd /shared
git clone https://github.com/VirtualFlow/VFTools.git
cd VFTools
git checkout 8afba5e
export PATH="/shared/VFTools/bin:$PATH"
最新バージョンではこの後の処理でエラーになるため、特定バージョンをハッシュで指定しています。
- VFToolsは OpenBabel というソフトウェアに依存しているため、OpenBabel もここでインストールします。
sudo yum install -y openbabel
- スクリプト
vfvs_pp_ranking_all.sh を実行し、リガンドランキングを作成します。
cd /shared/VFVS_GK
mkdir -p pp/ranking
cd pp/ranking
vfvs_pp_ranking_all.sh ../../output-files/complete/ 2 meta_tranche
スクリーニングされたリガンドのドッキングポーズを作成する
- 最初に、このドッキングシナリオのドッキングポーズが出力される新しいフォルダーを作成します。
cd ..
mkdir -p docking_poses/qvina02_rigid_receptor1
cd docking_poses/qvina02_rigid_receptor1
- VirtualFlow によって事前に構成されたドッキングシナリオ qvina02_rigid_receptor1 の上位 100 ヒットを抽出します。
head -n 100 ../../ranking/qvina02_rigid_receptor1/firstposes.all.minindex.sorted.clean > compounds
- スクリプト
vfvs_pp_prepare_dockingposes.sh を実行し、ドッキングポーズを作成します。
vfvs_pp_prepare_dockingposes.sh ../../../output-files/complete/qvina02_rigid_receptor1/results/ meta_tranch compounds dockingsposes overwrite
ls /shared/VFVS_GK/pp/docking_poses/qvina02_rigid_receptor1/dockingsposes.plain/
ドッキングポーズのファイル一覧の例
100_Z2093024139_2_T1.pdb 23_PV-001702179999_1.pdb 37_PV-001377853194_1_T1.pdb 50_PV-001288562049_1.pdb 64_Z812712648_5.pdb 78_PV-001873778304_2.pdb 91_PV-001826919885_5.pdb
10_Z2624037004_1.pdb 24_PV-001958058751_1.pdb 38_PV-001378044208_2_T1.pdb 51_PV-001826919885_1.pdb 65_Z91191850_1.pdb 79_Z2144418621_1.pdb 92_PV-001826919885_6.pdb
11_Z2211137992_4.pdb 25_Z2717222271_1.pdb 39_Z2364787117_1_T1.pdb 52_PV-001826919885_2.pdb 66_PV-001871323701_2.pdb 7_Z2087260951_3.pdb 93_Z2717222271_2.pdb
12_Z2624037004_2.pdb 26_Z2713204296_1.pdb 3_Z2087260951_4.pdb 53_Z812712648_1.pdb 67_Z2042828126_1.pdb 80_Z2593207602_1_T1.pdb 94_Z812712648_7.pdb
13_PV-001701895824_2.pdb 27_PV-000374192402_1.pdb 40_Z1418769667_2.pdb 54_Z812712648_8.pdb 68_Z2144418621_2.pdb 81_Z2593207602_2_T1.pdb 95_PV-001287209271_1.pdb
14_Z2087260951_1.pdb 28_PV-000376279119_2.pdb 41_Z1656518334_2.pdb 55_Z449211618_1.pdb 69_Z1175719058_1.pdb 82_Z510613592_1_T2.pdb 96_Z2441745039_1.pdb
15_Z2211139111_1.pdb 29_Z2596550737_1.pdb 42_PV-000380950674_1.pdb 56_Z1175719058_2.pdb 6_PV-001701895824_1.pdb 83_PV-000766555706_1_T1.pdb 97_Z2713537244_2.pdb
16_Z2700583334_2.pdb 2_Z2624037004_4.pdb 43_Z2717222271_3.pdb 57_Z2378042591_6_T1.pdb 70_Z2723142397_2_T1.pdb 84_PV-001002400892_1_T1.pdb 98_Z1668414848_2_T1.pdb
17_Z2211137992_2.pdb 30_PV-000376279119_1.pdb 44_PV-001702179999_2.pdb 58_Z2378340882_1_T1.pdb 71_PV-000256089451_1_T1.pdb 85_PV-001743414951_1_T1.pdb 99_Z1668414848_3_T1.pdb
18_Z2211139111_2.pdb 31_PV-001958058751_4.pdb 45_Z1668414848_1_T1.pdb 59_PV-000086046460_1_T1.pdb 72_PV-001089728404_1_T1.pdb 86_Z2084379853_2_T1.pdb 9_Z2087256678_2.pdb
19_Z2700586182_2.pdb 32_Z2700583334_1.pdb 46_Z1237025175_1.pdb 5_Z2087260951_2.pdb 73_Z3013461190_1_T1.pdb 87_Z2364787117_2_T1.pdb
1_Z2624037004_3.pdb 33_PV-001871323701_1.pdb 47_Z2505285340_1_T1.pdb 60_Z2364809982_1_T1.pdb 74_Z2893380031_1_T1.pdb 88_Z2366885184_1_T1.pdb
20_PV-001958058751_2.pdb 34_Z2638723223_1.pdb 48_Z1418769667_1.pdb 61_PV-001288562049_2.pdb 75_Z2155602585_3.pdb 89_Z2799914346_2_T1.pdb
21_Z2211137992_1.pdb 35_PV-000388401706_1_T1.pdb 49_Z1897122191_4.pdb 62_PV-001826919885_7.pdb 76_Z2046069599_1.pdb 8_PV-001958058751_3.pdb
22_Z2211137992_3.pdb 36_PV-000766555706_2_T1.pdb 4_Z2087256678_1.pdb 63_Z2717222271_4.pdb 77_Z1669288933_1_T1.pdb 90_Z1656518334_1.pdb
PyMOL のインストール
- NICE DCV 環境でドッキングポーズの可視化を行うため、PyMOL をインストールします。
今回はオープンソース版の PyMOL をインストールします。
cd /shared
sudo yum install -y gcc gcc-c++ kernel-devel python-devel tkinter python-pmw glew-devel freeglut-devel libpng-devel freetype-devel libxml2-devel glm-devel msgpack-devel netcdf-devel
sudo yum install -y python3 python3-devel python36-qt5
CentOS 7のデフォルトのGCCのバージョンが古く、そのままでは最新のPyMOLをビルドできないため、SCL を用いてGCC 8 をインストールします。
sudo yum install -y centos-release-scl
sudo yum install -y devtoolset-8
GCC 8を有効化します。
scl enable devtoolset-8 -- bash
準備ができたので PyMOL をインストールします。
git clone https://github.com/schrodinger/pymol-open-source.git
git clone https://github.com/rcsb/mmtf-cpp.git
mv mmtf-cpp/include/mmtf* pymol-open-source/include/
cd pymol-open-source
prefix=/shared/pymol-open-source-build
python3 setup.py build install --home=$prefix
Warning が出力されることがありますが、インストールを継続して問題ありません。
NICE DCV への接続
- コマンド pcluster dcv connect を実行し、NICE DCV への接続 URL を取得します。
コマンド pcluster dcv connect は Head Node ではなく、Cloud9 上から実行します。
pcluster dcv connect pcluster01 -k ~/environment/guest01-key.pem
取得した URL をブラウザで開きます。
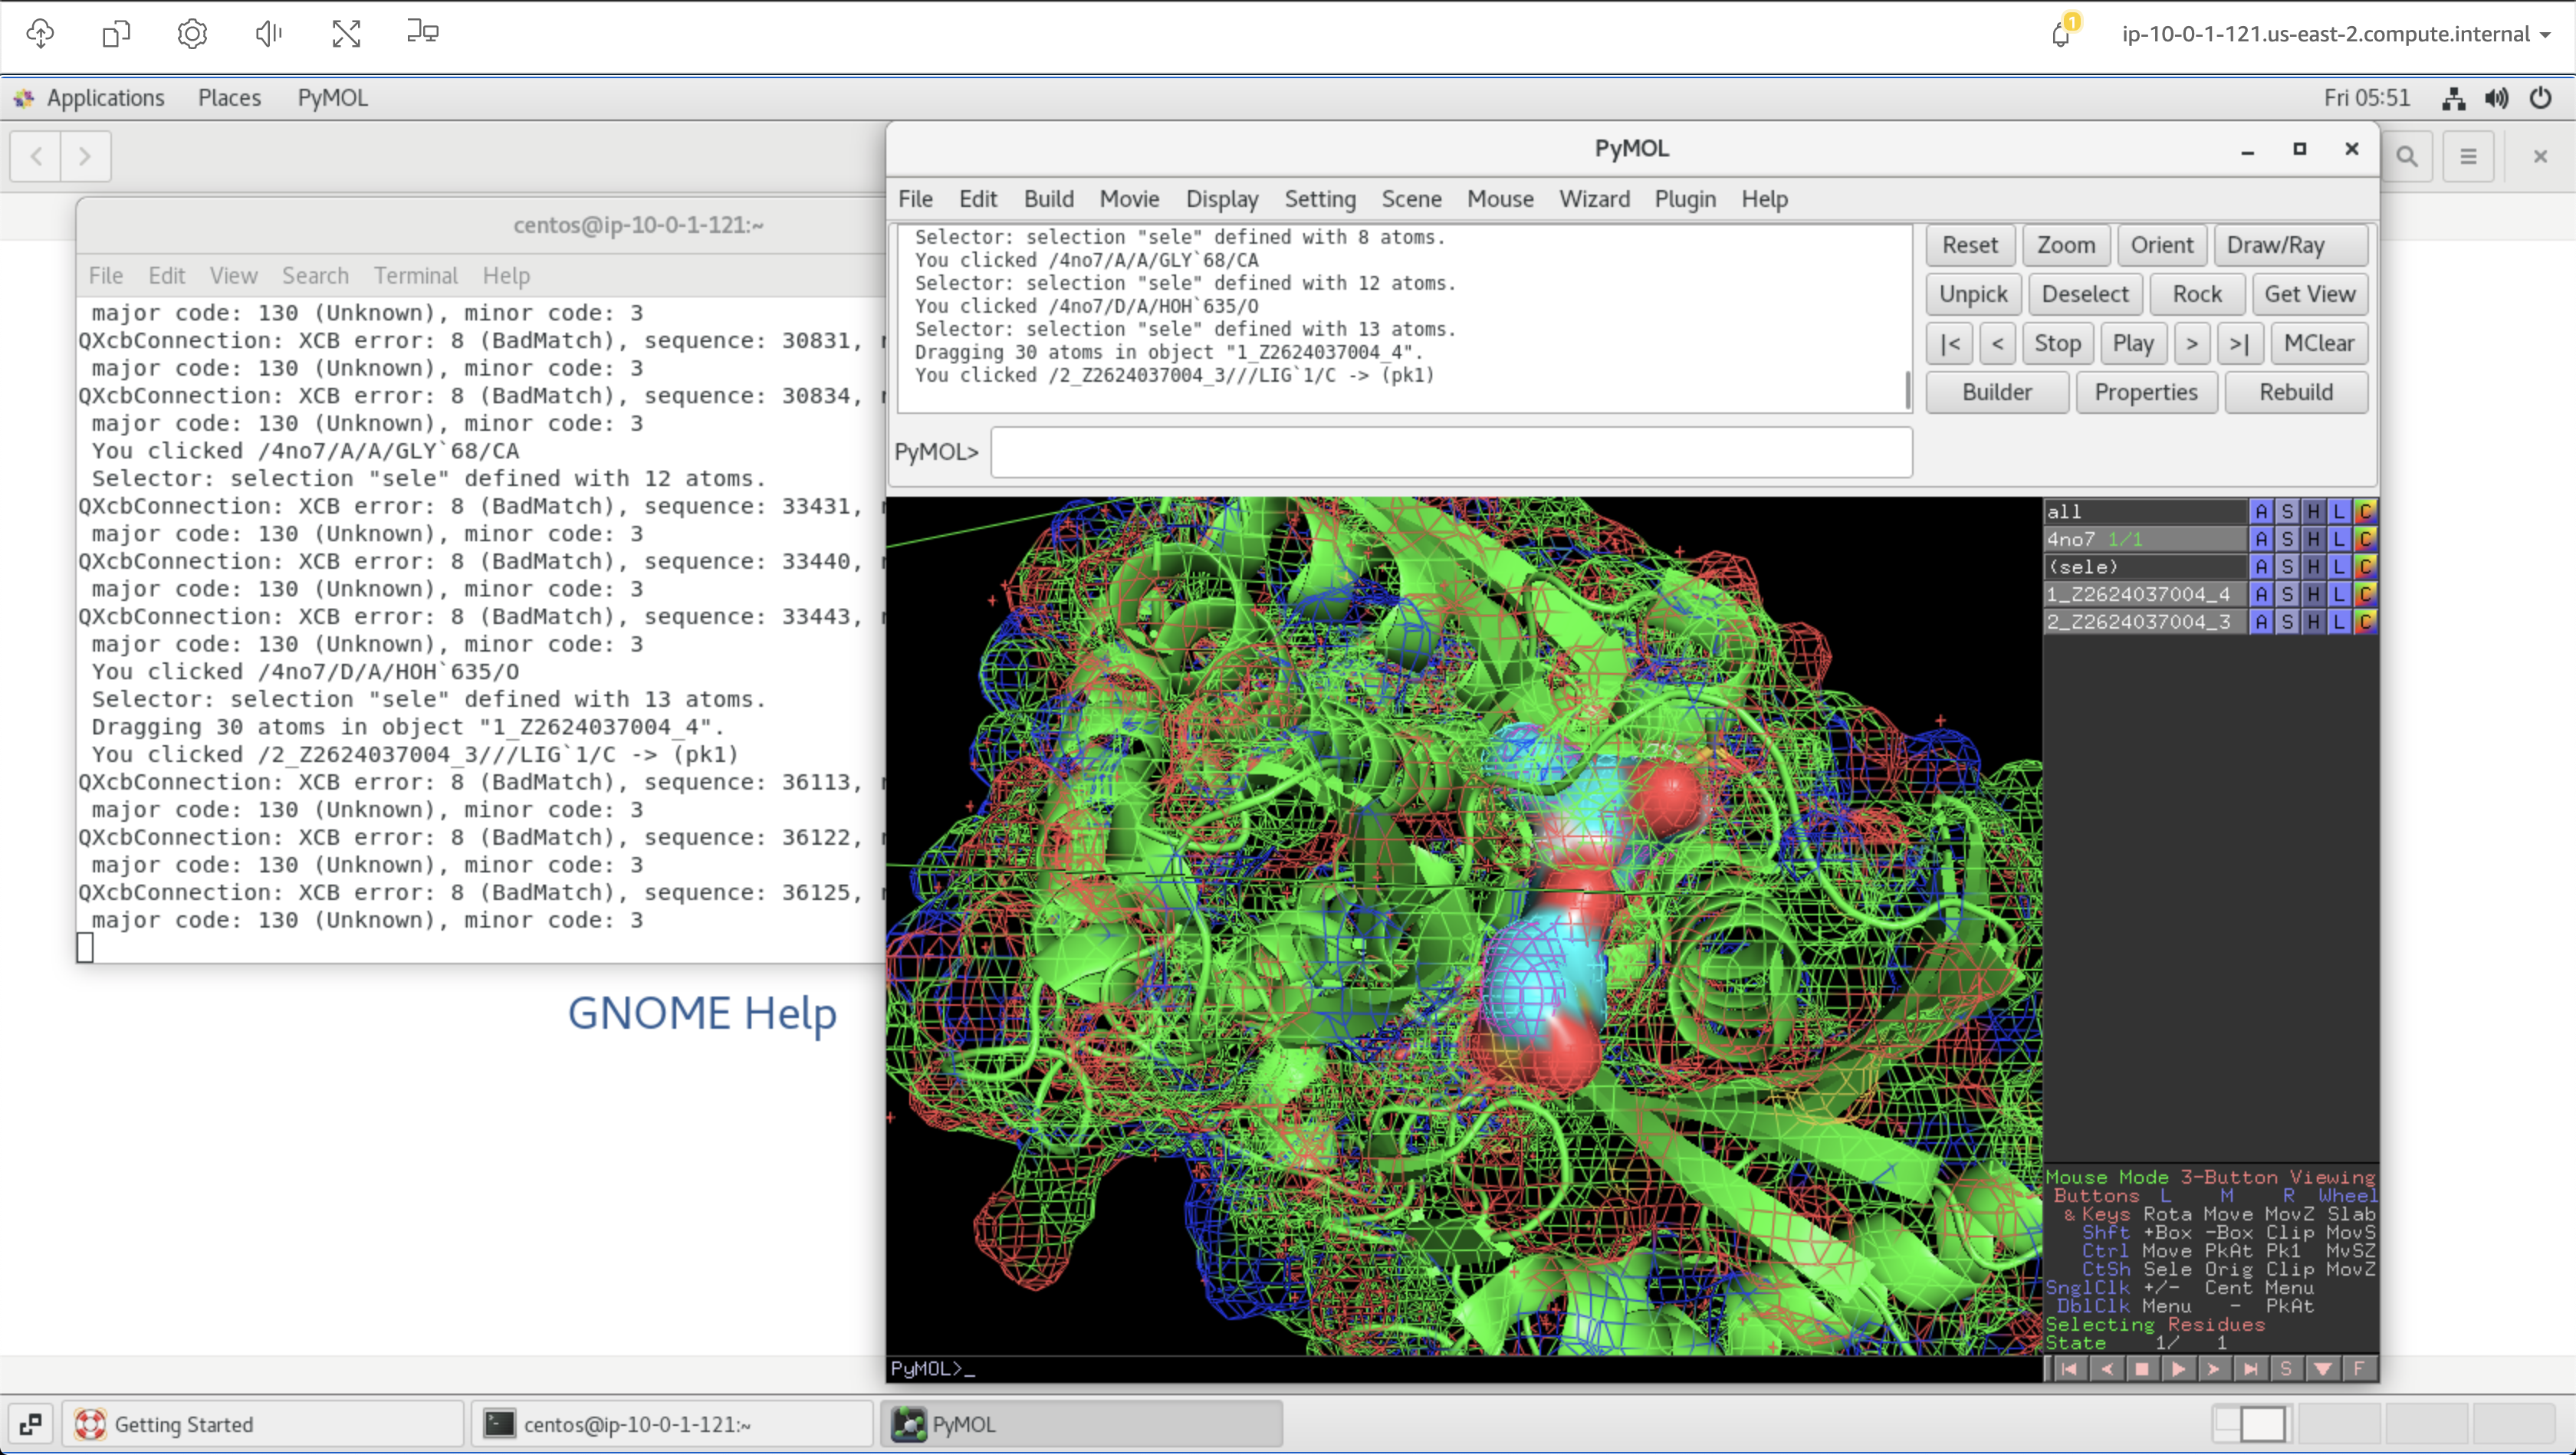
NICE DCV 環境でドッキングポーズの可視化を行う
- NICE DCV 上で「Applications」→「System tools」→「Terminal」を開きます。
- 以下のコマンドを実行し、PyMOL を起動します。
/shared/pymol-open-source-build/bin/pymol
- 起動した PyMOL からターゲット構造 (PDB ID 4NO7) やドッキングポーズの PDB ファイルを開いて、可視化を行います。